Overview
Other articles in this series: Part 1; Parts 3-5 are forthcoming
Note: further cartographic terminology from the records can be found in the Glossary.
Many of the maps on QDL were produced before modern survey technology was available and relied instead on traditional methods. Surveying – determining positions on the land surface – is a complex operation, and the more accurate the map, the more complex the operation.
Where to start?
The surveyor’s first task is to select an origin. This is a starting point whose coordinates are accurately known and from which measurements are taken to fix all other points. Occasionally a suitable point exists nearby, perhaps an observatory or a trusted marker from a previous survey. If not, the surveyor must establish a new one. Early markers often comprised a vertically sunk wooden pole, progressing over time to a metal scaffold pipe, then to a concrete block with central marker, and by the 1930s to the more familiar pillars still seen today. Typically, these markers occupy high ground with good visibility across the survey area.
Archive items in this article


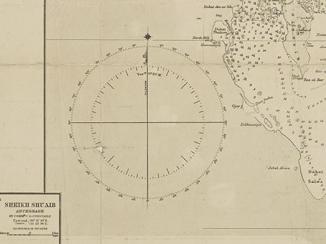
The origin’s coordinates (latitude and longitude) were determined by observations to stars of known trajectories. Surveyors achieved this using a theodolite to measure horizontal and vertical angles. This instrument includes a telescope, whose horizontal and vertical inclination are indicated on gradated measuring circles, and a spirit level to maintain horizontality. The theodolite is mounted directly over the origin and readings recorded.

Traversing
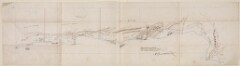
Survey methods are usually governed by practicability rather than desire. Explorers may forgo a time-consuming and equipment-intensive survey in favour of a low-order one that is less accurate. One such method for this was the traverse. Here, the position of a line of points was fixed by measuring successive distances and directions from a known starting point, perhaps the origin. Traverses were particularly suitable for mapping expedition routes and generally only portray nearby features. Distances were typically determined with a measuring wheel, simple pacing or, in some instances, ‘camel hours’.

Direction was usually taken with a prismatic compass A compass fitted with a sighting vane and magnifier to achieve additional accuracy. . Similar to a standard magnetic compass, the prismatic version additionally incorporates an object vane (effectively a sighting hair), an eye vane (to read the compass gradations), and an internal glass prism (to magnify the gradations) enabling readings to within half a degree.

Traverses can be enhanced with offsets – measurements taken at right angles from the traverse to nearby points of significance. As a traverse progresses, cumulative errors in distance and direction can produce a large yet unknown error at the final point. To ‘close’ a traverse, surveyors verify the end coordinates, either by finishing on a known point or determining the position by observation to the stars. Any closing error (i.e. discrepancy between the known and traversed values) is distributed proportionately throughout the traverse.

Plane tables
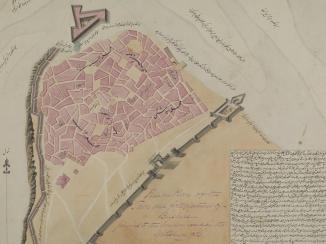
While traverses are fine for linear features, they are unsuited to mapping areas. The plane table A basic surveying technique using an alidade attached to a horizontally mounted drawing board. meanwhile was a quick, if approximate, apparatus for this. It uses an alidade (an instrument to set lines of sight and measure angles to distant features) attached to a tripod-mounted drawing board.

Plane tabling works by plotting intersecting sight lines from two established and intervisible survey points. The drawing board is aligned to north over the first survey point using a prismatic compass A compass fitted with a sighting vane and magnifier to achieve additional accuracy. . Using the alidade as a sighting vane, lines are drawn on the board towards the features to be mapped. The second survey point is similarly sighted, and the base line (see below) drawn towards it. The distance is calculated between the two known survey points, and the second one is plotted on the board at a distance corresponding to the desired map scale.
When the plane table A basic surveying technique using an alidade attached to a horizontally mounted drawing board. is moved to the second survey point, the process is repeated. The board now has two sets of crossing lines, with the intersections representing the positions of sighted features. Finer detail is then sketched in between the plotted points.

Base lines
Meanwhile, full and accurate surveys – as required by governments for national mapping programmes – demand greater exactness. For these high-order surveys, the origin was still established using a theodolite, albeit with more accurate observations. However, the prismatic compass A compass fitted with a sighting vane and magnifier to achieve additional accuracy. was not sufficient to determine north. Orientation was instead established by theodolite observations to Polaris (the North or Pole Star).
A base line was selected, usually a few miles long and across flat terrain, providing a known distance from which all others could be determined. Before electronic technology, surveyors achieved this by summing a series of successive tape measure lengths. However, potential issues arising from temperature, tension, suspension, weather, sloping, variations in gravity, and height above sea level, as well as the curvature of the earth all needed to be accounted for. By applying a multitude of complex adjustments, accuracies of just a few parts per million were obtained – not bad with a tape measure!

Triangulation
Measuring long distances was clearly difficult, so it was avoided where possible. Measuring angles was faster, and exceptionally high accuracy was achievable with a good theodolite. The technique of triangulation was first proposed in 1533 by Dutch map maker Gemma Frisius. Here the positions of a network of points are determined by connecting them in a series of triangles and measuring at least two of the internal angles of each. If one side length of the first triangle is measured (i.e. the base line), then all remaining lengths and angles can be calculated. Network points were usually identified on the ground by permanent survey marks, typically triangulation A surveying technique in which the position of a network of points is determined by creating a series of triangles between them and measuring at least two of the internal angles and one side length. pillars (or trig points).
Related Articles


Like traversing, cumulative errors in triangulation A surveying technique in which the position of a network of points is determined by creating a series of triangles between them and measuring at least two of the internal angles and one side length. could develop as the network progressed, so a second ‘check’ base line was measured at the far end of the network. The result was compared to the theoretical length as calculated by trigonometry, with closing errors distributed proportionally.
Using all these techniques, we can now determine coordinates. However, a single point can also have several (indeed a potentially infinite number of) different latitudes and longitudes. More on that in Part 3 (forthcoming).