Overview
Other articles in this series: Part 2; parts 3-5 are forthcoming.
Note: further cartographic terminology from the records can be found in the Glossary.
The QDL has a generous range of maps, and our journey here begins by attempting to classify them. To understand a map fully, we need to appreciate the map-making process, including the methods of the surveyor. From the surprising complexities of position fixing, to the mysteries of unravelling marginalia, maps abound with challenging terminology.
Archive items in this article


Maps are drawn for many purposes, including navigation, planning, administration, tourism, and military campaigns. The QDL hosts everything from world to city maps, accurate to sketch maps, themed to general maps. Categorising them can be fraught, because some maps display so many characteristics that they fit comfortably into numerous categories. What follows is an inventory of the map categories found on the QDL.
Maps, Charts, and Plans
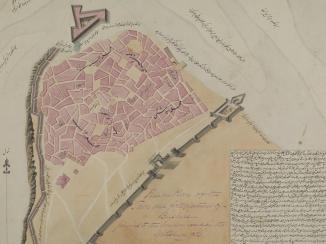
Like many specialisms, cartography – the art and science of drawing maps – has its own lexis. The term map embraces almost any kind of diagrammatic portrayal of an area as viewed from above. However, some maps can be described more precisely. Plans, for example, are large-scale maps of relatively small areas, the generous scale allowing depiction of such details as residential roads, pavements, individual buildings, and house numbers.
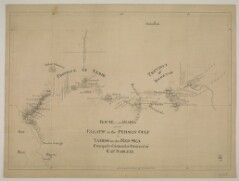
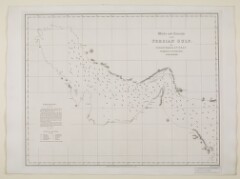
Charts, on the other hand, are specifically for mariners and aviators. Hydrographic charts focus on water bodies and their land margins, typically portraying soundings Measurements of the depth of a body of water. , rocks, sands, navigational aids (for example, lighthouses and buoys), and anchorages. Meanwhile air charts might include runway information, air space boundaries, and minimum flying heights (as calculated from terrain elevations and obstructions such as tall buildings and power lines).
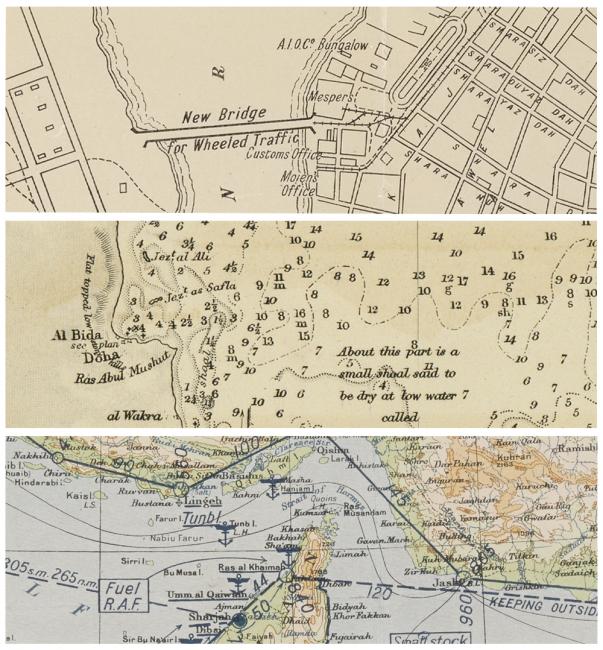
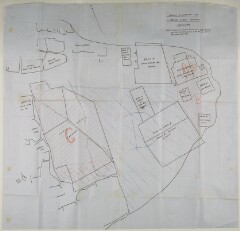
Top: Extract from a sketch plan of Naresi and Ahwaz. General Staff, India, 1938. IOR/L/MIL/17/15/24, f. 65r
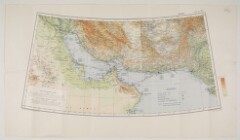
Middle: Extract from a hydrographic chart of the Gulf. The numbers are soundings in fathoms. The letters show seabed characteristics (M = mud, G = gravel, Sh = shingle). The dots reveal the extent of sand and mud at low tide. Note the anchor symbol at Doha. Admiralty, 1912. IOR/X/3828/2837b, f. 1r
Bottom: Extract from an air chart of the Gulf. Following international conventions, air information is shown in purple. War Office, 1933. IOR/R/15/2/263, f. 194r
Topographic versus The Rest
A fundamental distinction exists between topographic maps and all others. Serious cartophiles (map enthusiasts) regard topographic maps as “proper” maps, in that they show features in their true position. Most official government mapping falls into this category. The rest comprise mainly sketch maps drawn when an approximate representation will suffice or where time and/or resources are limited.

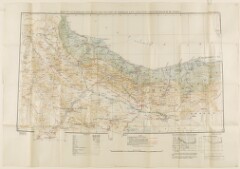
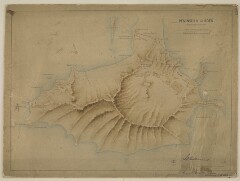
Top: Extract from a topographical map of Tehran and north-west Persia. Survey of India, 1922. IOR/L/MIL/17/15/23, f. 302r
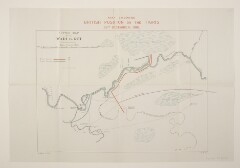
Bottom: Extract from a sketch map of the Trans-Persian Railway. Cartographer unknown, 1928. IOR/L/PS/10/794, f. 156r
One particular type of non-topographic map is the topological map. This preserves the relationships between features while sacrificing other properties to improve clarity. Metro maps are good examples, where stations appear in the correct order and lines interchange in the correct places, yet distortion is applied to scale (stations are depicted as equidistant irrespective of the true distance) and direction (lines are always drawn horizontally, vertically or on forty-five-degree diagonals).

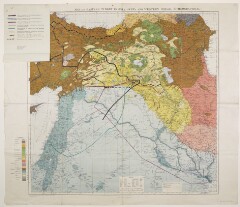
Thematic maps
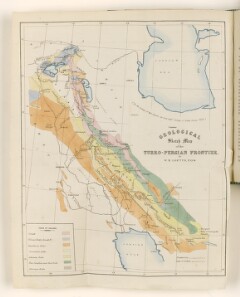
Thematic maps emphasise information on a particular topic, perhaps geology, population, or climate. Usually, the map comprises two distinct information layers: an unobtrusive background or base map A map portraying background detail. (often topographic in nature) and a more prominent thematic layer. For example, geology maps typically combine a faint base layer of hills, rivers, roads, railways, and towns, with another superimposed layer showing the underlying rock types. Other categories of thematic map on the QDL include cadastral (property ownership) maps, population maps, and maps portraying meteorology and ocean conditions.

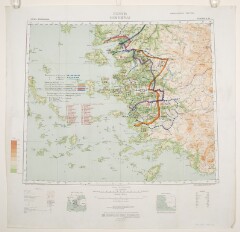
Overprints and Overlays
Sometimes extra information is added to a map later. The existing map becomes a base map A map portraying background detail. , and the additional information (for example troop positions) may be added either by printing over it (an overprint Additional information printed on to an existing map. ), or by plotting it on to a transparent or translucent sheet and aligning (or keying) it to the existing map (an overlay A transparent or translucent sheet designed to be placed over a map to show additional information. ). Overprints Additional information printed on to an existing map. and overlays A transparent or translucent sheet designed to be placed over a map to show additional information. are also popular methods for updating information, such as adding new roads.


Left: Mss Eur F112/570, f. 28r | Right: Mss Eur F112/570, f. 27r
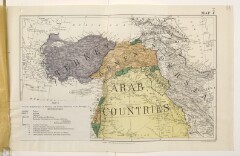
Isopleths and Choropleths
Maps are also useful tools for showing geographical trends in statistical data (e.g. climate or population). Two types are particularly suited. The first is the isopleth, a map comprising lines joining points of equal value. For example, lines joining points of equal height are contours and lines joining points of equal air pressure are isobars. Structure contours, specifically, show the height above an underground structure (e.g. the upper surface of a naturally occurring body of underground water), and often bear no relation to land surface contours.

The second type is the choropleth, a map that uses a graded colour scale to portray the average value of a particular attribute within defined geographical boundaries. Where isopleths and choropleths show information on specific topics, they are also thematic maps.

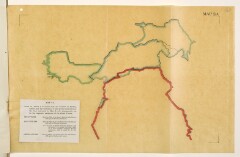
Route Maps
During journeys of discovery, speedy travel requires light loads, and there is neither the time nor equipment for a full survey. A route map A map depicting a specific journey. must suffice. These plot just the route, the features along it, and significant features visible from it. Many route maps A map depicting a specific journey. are long and thin and often aligned to the shape of the paper rather than adopting the more conventional ‘north at the top’.

Related Items
The QDL also houses items related to maps. Cross sections The shape revealed by cutting vertically through a land surface at right angles to the feature of interest. show the shape revealed by cutting vertically through the land surface at right angles to the feature of interest. The most common types are geological cross sections The shape revealed by cutting vertically through a land surface at right angles to the feature of interest. (exposing the sub-surface rock structure) and river cross sections The shape revealed by cutting vertically through a land surface at right angles to the feature of interest. (portraying the shape of a river valley at right angles to the direction of flow).

Perpendicular to a cross section The shape revealed by cutting vertically through a land surface at right angles to the feature of interest. is the profile (or long profile), the shape revealed by cutting vertically through the land surface along the feature’s length. For example, the long profile of a river valley shows the river’s changing gradient from source to mouth. Similar profiles can show the gradients of roads and railways.
Related Articles


The QDL is a rich resource, and its maps are no exception. Whether it is a topographic map for geographical context, a thematic map for more specific needs, or an explorer’s sketch map to unlock the undiscovered, the QDL has a map for everyone.
Part 2 examines how these maps were made.